Gas Law Activity Introductory Information

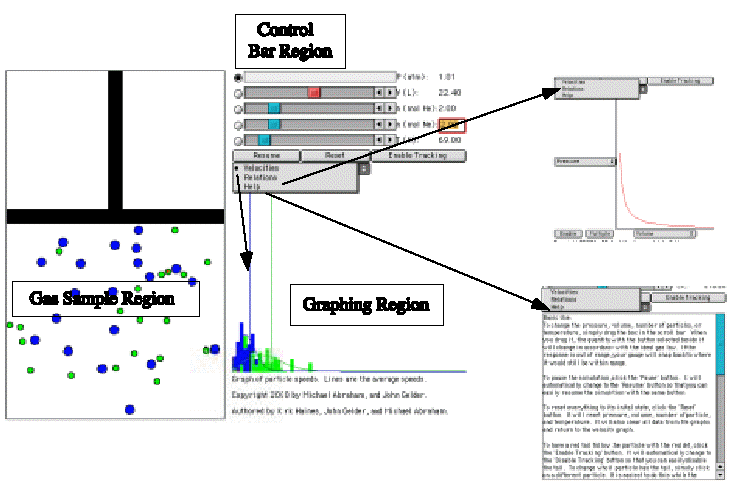
There are three important regions that require some discussion.
The Gas Sample Region has the most activity. It is a container with a plunger.
To explore the behavior of the gas sample you can change the variables located
in the Control Bar Region.
The Control Bar Region shows five scrollbars bars, one for pressure (in units
of atmospheres), one for volume (in units of liters), two for mol of gas (one
for He gas and the other for Ne gas), and one for temperature (in units of Kelvins).
To the left of each scrollbar is a radio button. When selected, that particular
variable(called the dependent variable) is calculated based on the value of
the other four variables. In the default mode the pressure scrollbar's radio
button is selected so the pressure of the gas sample is being calculated. As
a simple exploration try moving each of the scrollbars and observe the effect
on the gas sample. These effects will be addressed in more detail in this experiment.
You can click the mouse on the Reset button located below the temperature scrollbar
to return to the original conditions. The Pause button will suspend the motion
in the gas sample while the Enable Tracking button will turn the red tracking
line on and off. Below the Pause Button is a fourth button different from the
previous three in that it is a dropdown button. Clicking and holding the mouse
button will reveal three choices: velocity (default); Relations (graphing);
and Help. The default mode is Velocities.
The Velocity Distribution Region shows a plot of the velocity distribution
in the gas sample. Observe the behavior of this region while changing each of
the variables in the Control Bar Region. The Relations view reveals an xy graph
with a popup menu on each axis. Selecting the popup menu on either axis provides
a list of the variables shown in the Control Bar Region. The two buttons, Enable
and Multiple are used when plotting pairs of variables. For example, in Figure
II pressure has been selected on the y-axis and 1/volume is selected on the
x-axis.

