Demonstration 3: Paper Chromatography
Introduction
Chromatography is used to separate the components of a mixture, operating
on the basis of selective adsorption. The solvent moves through the porous
material called the adsorbent. The various parts of the mixture are attracted
to the adsorbent differently. The more strongly attracted parts do not
move as
far as the more weakly attracted parts. It is possible to calculate an
R f value, which is defined as the distance traveled by the
solute divided by the
distance traveled by the solvent. The purpose of this demonstration is
to separate the pigments in a food color by paper chromatography.
Safety
Proper laboratory safety procedures must be followed. Alcohols are
flammable; no open flames are allowed. Any substances spilled should be
immediately washed off with large amounts of water.
Materials
2
Petri dishes (less than 11 cm diameter)
Capillary
tube (thin-walled, open-ended melting point tube or Pasteur pipette)
Filter
paper, 11 cm
Ethanol,
95% or absolute (Solvent 1)
0.l%
Sodium chloride, NaCl (0.1 g NaCl or table salt per 100 mL water; Solvent
2)
Food
coloringGreen typically works best, but try more than one color
Scissors
Distilled
water
Procedure
1. Cut two pieces
of filter paper as shown in Figure 3.
Fold the tongue down so that it will just touch the 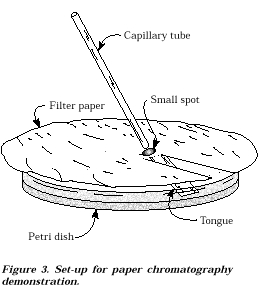
surface of the
Petri dish.
2. Using the
capillary tube to transfer the food dye to the paper,
make a small
spot behind the folded tongue with one of the
samples of food
coloring. When the spot is dry, touch the
capillary tube
to the paper again to increase the amount of
pigment on the
paper. Do not increase the size of the spot;
just try to
make it more concentrated.
3. Prepare the
other sample the same way.
4. Place enough
of one of the solvents to cover the bottom of
one of the Petridishes.
Repeat with the other solvent in another
Petri dish.
5. Place one
piece of filter paper over each dish with the tongue
just touching
the solvent.
6. After the
solvent is well absorbed (i.e., traveled along) onto the
paper without
completely moving to the edge, remove the filter
paper and mark
the outer edge of the solvent line using a pencil.
Do not allow
the solvent front to reach the edge of the filter paper.
When the papers
have dried, mark the edges of each pigment using a pencil.
7. Calculate
the R f value for each spot in each solvent.
R f = distance traveled by solvent
distance traveled by solute
(NOTE: R f values are always £ 1, and that a smaller R
f value corresponds
to a more tightly held solute.)
8. If time permits
redo with other colors.
Data Analysis
1. How far did each solvent travel?
2. How many pigments were observed?
3. How far did each pigment travel from the original spot?
4. Calculate the R f value of each major pigment.
5. Which color had the largest R f value?
6. Was the same order of elution (as determined by the order of the
colors observed) for each solvent?
Extensions
1. Many inks and dyes can be separated in this way (see Demonstration
4).
2. Likewise you can try many other solvents, e.g., nonpolar organic
solvents.
Mixed solvents (e.g., aqueous ammonia and ethanol) can also be used.
3. This demonstration can also be developed into a full laboratory
experiment.
4. Chromatographic paper used in chromatographic developing tanks can
also be used but is unnecessary. Strips or cylinders of rectangular
chromatographic paper in small glass jars with covers or beakers with
Petri dish covers can also be used. The one directional movement allows
the development of several spots at once.
5. For a detailed experiment using paper chromatography with food dyes,
see Markow, P. G. (1988). J. Chem. Ed, 65, 899-900. This paper also
references six other versions of this experiment or demonstration for
teaching the basics of chromatography.