Activity 1: Volume and Temperature Changes in a Gas
Introduction
LABORATORY ACTIVITY: TEACHER NOTESPurposeGases may be studied in relation to certain variables: pressure, volume, temperature, and amount (moles). In this laboratory activity we will develop a relationship between the volume and temperature of a gas sample and, by extrapolation, estimate the value of absolute zero, theoretically the lowest possible temperature obtainable.SafetyTo determine the relationship between the volume and the temperature of a gas and to estimate the value of absolute zero.Procedure1. Wear protective goggles throughout the laboratory activity.2. Whenever a burner is used, care should be taken to avoid burns.
3. Do not leave thermometer in beaker between measurements.
Data Analysis1. Completely fill an empty pipet with water.2. Count the number of drops it takes to empty the pipet. (Repeat for better accuracy using a new pipet.)
3. Record the average number of drops. This number represents the volume of the pipet. It also represents the volume of gas at the higher temperature in this activity.
4. Fill a tray half full of water. Record room temperature. Adjust the temperature of the water until it equals that of the room.
5. Half fill the beaker with water. Heat until the water is about 20 °C above room temperature.
6. Holding a new pipet by the stem, immerse its bulb in the warm water in the beaker. Hold in the water for 1 min to allow the temperature of the air in the pipet become equal to that of the water.
7. Pinch the end of the pipet stem with pliers or a fingernail to seal it off. Record the temperature of the warm water in the beaker.
8. Fully submerge the pipet in the tray containing room-temperature water. Make sure that the stem is under the water and unseal. What happens in the stem of the pipet? Keep the pipet submerged until no further changes are noted (about 1 min).
9. Remove the pipet from the water and dry the outside. Count the number of drops of water that were drawn into the pipet. This number, subtracted from the original number, represents the volume of the air sample at the lower temperature.
10. Increase the temperature of the water bath by 10 °C and repeat the procedure using a new, dry pipet.
11. Repeat Steps 8-10 until a temperature of about 90 °C is reached.
12. Thoroughly wash your hands before leaving the laboratory
Temp. °C Volume at higher
Temp. (in drops)
(Volume of empty pipet)Volume at lower
Temp. (in drops)Room Temp. 1 2 3 4 2. Absolute zero theoretically measures the limit of molecular motion. What is the volume of an ideal gas sample at absolute zero?
3. If we created a new temperature scale where the value of absolute zero were zero, what would be the value of 0 °C?
4. Superconductors function best at very low temperatures, below the boiling point of liquid nitrogen (195.8 °C). Select one of your graph lines. What would be the volume of that air sample at 195.8 °C?
Activity 1: Volume and Temperature Changes in a Gas
Major Chemical Concept
LevelThe volume of a gas sample is directly proportional to its absolute (Kelvin) temperature. The volume of an ideal gas theoretically becomes zero at 273 °C, or 0 K.Expected Student BackgroundThis laboratory activity can be done by basic, general, and honors students.TimeStudents should be aware of the variables (pressure, temperature, moles of substance, and volume) by which gas samples are described. They should know the relationship between gas temperature and its average kinetic energy. They should be reminded about construction of graphs and how to draw the best-fit line.SafetyIf students work in pairs, the experimental work can be completed in 40 min. Additional time is needed for analysis of data.Materials (For 24 students working in pairs)No additional precautions.Advance PreparationNOTE: A hot plate may be used in place of the burner and ring stand.
- 12 Beakers, 800-mL, half filled with tap water (Allow to come to room temperature)
- 12 Trays or shallow plastic containers, containing enough water to cover pipet.
- (Allow to come to room temperature)
- 96 Plastic (BeralÔ) pipets, small, new. These must be dry. (Pipets may be obtained from many supply houses including Flinn Scientific Inc., Batavia, IL 60510.)
- 12 Thermometers (°C)
- 12 Burners
- 12 Ring stands with iron rings
- 12 Wire gauze
- 12 Pinch pliers
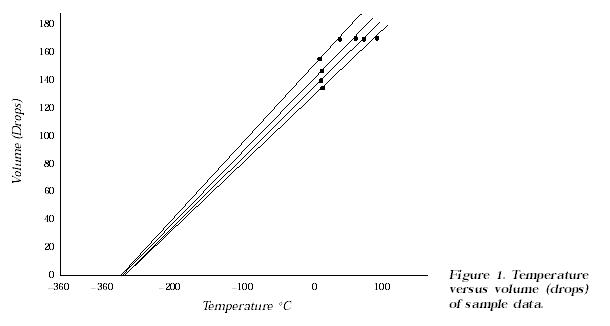
Pre-Laboratory DiscussionRemind students of the variables in the gas laws. In this activity, temperature and volume are measured, while pressure remains constant. Four graph lines are drawn; each data pair involves a sample with different gas amount (moles).Before students start the laboratory activity, demonstrate how to fill the pipet and how to count drops. To fill, squeeze as much air as possible from the pipet and insert stem in water. There will be some trapped air; it can be removed by holding the pipet vertically (bulb down), squeezing out the air so the stem is filled with water, then inserting the stem in water to fill completely. The bulb must be squeezed very gently to count each separate drop. A typical pipet contains between 100 and 175 drops.Suggested pre-laboratory discussion question:
- What happens to the volume of an inflated balloon when you place it in hot water or very cold water?
Teacher-Student InteractionAnticipated ResultsStudents will need help filling their pipets. The best way to seal a pipet is to pinch it with a fingernail. Students should count drops carefully and be sure to use a new pipet for each determination. Students will need help drawing graphs scalingshould include temperatures in the range +90 °C to 300 °C.
Some suggested questions to pose to students during the activity:
- What gas are we using? [Aira mixture of nitrogen and oxygen gases with traces of other gaseous substances.]
- What is being held constant in this laboratory activity? [The pressure.]
- How could we determine the pressure? [Barometer]
- Why do you need to keep the pipet stem below the water? [To keep air from getting in or out.]
- Why does some water enter the pipet as it cools to room temperature? [When the air is heated the volume
increases and some air leaves the pipet. As the pipet cools, the air contracts and draws some water into the stem.]- Do the four graph lines have the same slope? [No]
- Why do they all converge at approximately the same temperature at a zero volume? [V is directly proportional to T (absolute temperature)if V becomes zero, then T (absolute) also becomes zero, despite the amount of gas in the sample.]
Temp. °C Volume at higher
Temp. (in drops)
(Volume of empty pipet)Volume at lower
Temp. (in drops)Room Temp. 23 170 170 1 44 170 157 2 67 170 147 3 78 170 136 4 89 170 131 Answers to Implications and Applications
Post-Laboratory Activities1. There is a direct relationship.
2. Volume is zero.
3. Guide students to draw new temperature scale along the side of graph
starting at the intercept that should be about 300 °C. Give them the accepted
value of 273 °C or 0 K. With the new scale, 0 °C would equal 273 K.
4. Can be found from students graph.Extensions1. Show sample problems that relate gas temperature to volume.
2. Use graph to determine temperature at which air will have a certain volume and vice versa .
3. Demonstrate Charles Law using a 30-mL plastic hypodermic syringe. Trap about 20 mL of air inside and close with cap. Place syringe in hot water; measure the change in volume. Trap 10 mL of air and repeat, showing that graph of T-V slopes differ.
4. Have students convert temperatures from kelvins to degrees Celsius, and vice versa.
5. Discuss the concept of absolute zero and note that although molecular motion will cease, motion within molecules will continue.Assessing Laboratory Learning1. Have students complete a related activity using a syringe rather than a pipet. If two series are done, one with 10 mL trapped air and one with 20 mL, two lines will be obtained with different slopes. With more able students the slopes can be determined; they will differ by a factor of two due to the difference in the moles of gas:
PV = nRT
V = (nR/P)T (nR/P) is a constant = k
V = (k) T k = slope of plotted line on a V vs. T graph
Thus, if n doubles, k (slope) doubles2. Allow students to experiment with inflated balloons in a dry ice/isopropyl alcohol mixture (CAUTION: extremely cold ) and in warm water, comparing balloon sizes.
3. Have students construct graphs from other data and determine the value of absolute zero. Use milliliters rather than drops for the volume units.
4. Charles discovered the temperature-volume relation for gases due to personal interest in balloons. Discuss the use of balloons in warfare and for domestic purposes before airplanes were invented.
1. Use the questions suggested (in Teacher-Student Interaction section) on a test.
2. Have students determine the value of absolute zero from a graph constructed from other data.
|
|
|
|
|
|
|
|
|
|
|
|
|---|