PLE for Monday, March 3, 2002
Introduction
Please read the following information before continuing to the PLE.
In this PLE you will use some new software that Dr. Abraham and I, with the
able assistance of Mr. Kirk Haines, are working on. This is a beta version of
the software so there is the possibility there may be problems depending on
the configuration of your system. If you have any trouble please contact Dr.
G with the specific details of the problem. I recommend using Microsoft's IE
browser to run the simulation. I think Netscape will run the software on a PC
but this new software does not work in Netscape on a Macintosh.
Before going to the PLE I need you to be a little familiar with the screen
design and the buttons.
Below are some screen captures with a brief explanation. If you are adventuresome
skip all this stuf and go to the PLE.
Important Information.
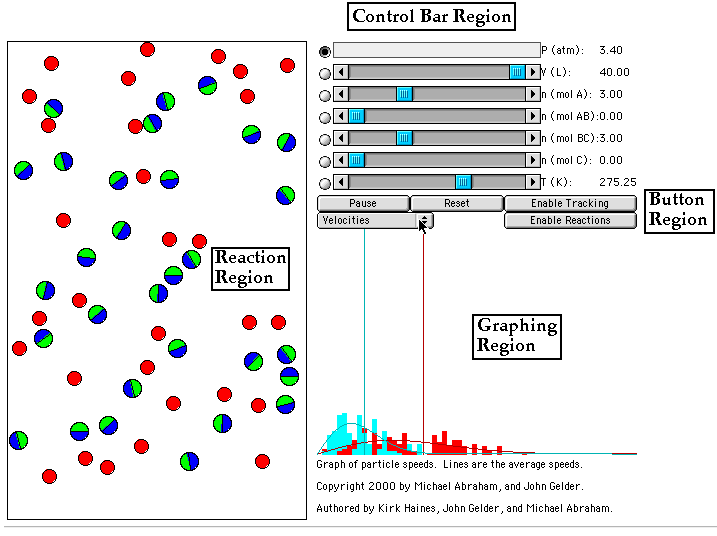
As shown in Figure I below the screen of the simulation is composed of four
different regions; Control Bar, Reaction, Button and Graphing.

Figure I.
The Control Bar region has slidebars to change pressure, volume, moles of
reactants (A and BC) and products (AB and C) and the temperature. In this PLE
we will only be changing the amount of reactants and or products. You can change
any of the other varialble that you want, but for PLE17 leave P, V and T alone.
To the left of each slidebar you can see a letter indicating the variable and
a number. For example in the Figure the pressure is 3.40 atm, the volume is
40 L and the temperature is 275.25 K. Can you see how many moles of reactants
and products there are?
The Reaction region shows the status of the reaction at the atomic/molecular
level. Initally the Reaction region shows the reactants. This region changes
when you click on the Enable Reactions button in the Button Region. The Reaction
Region is important during the course of the reaction as it will show the reaction
as it occurs. You should also watch the Control Bar region. As the reaction
occurs you can see visually the change in amounts of reactants and products
in the Reaction region and you can watch the numbers change in the Control Bar
region.
The Button region has several important buttons. The 'Enable Reaction' button
starts the reaction. When the reaction is occuring this button changes to a
'Disable Reaction' button. The other buttons are also important. The 'Pause'
button will stop the movement of the particules in the Reaction region. The
'Reset' button will re-set all of the conditions to their default values. The
'Tracking' button will show a red line to 'track' the movement of one of the
atoms. If that atom reacts, the track will move to a new atom.
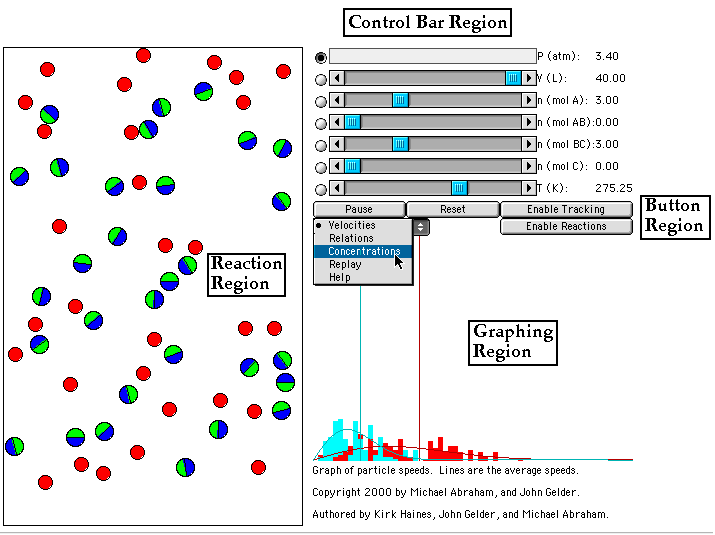
In Figure I you can see the mouse on the dropdown button with the word 'Velocities'
showing. Clicking the mouse on this dropdown button reveals several choices
as shown in Figure II.

Figure II.
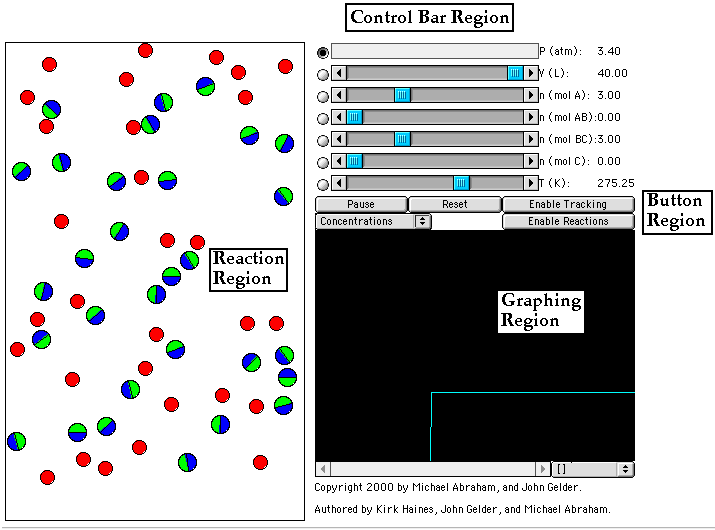
Select 'Concentrations'. This selection will show a chart plotting the concentrations
of the species in the Reaction region over time. So before the reaction begins
the concentrations do not change. In this version of the simulation there is
no y-axis to tell you the numeric concentration. You must look in the Control
Bar region to see what the concentration is.
When 'Concentration' is selected the display looks as in Figure III. below.

Figure III.
Once the 'Concentrations' display is showing in the Graphing Region you are
ready to Enable the reaction to see what happens.
If you have any questions or encounter any problems running this PLE contact
dr. g.
Go to the PLE. (NOTE: It will take a moment
for the simulation to load so hang in there.)