Clausius-Clapeyron Equation
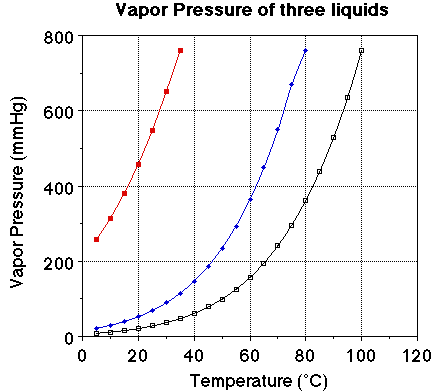
Next we looked a plot of vapor pressure (y-axis) versus temperature (x-axis)
and observed the exponential increase in vapor pressure with temperature. We
also discussed the definition of a boiling point. The correct definition of
boiling point is the temperature at which the vapor pressure of a liquid equals
atmospheric pressure. With this definition we can understand why liquids boil
at lower temperatures when heated at high altitudes. At high altitudes the atmospheric
pressure is lower, there is less atmosphere above the surface at high altitudes.
If the atmospheric pressure is lower water will boil at a temperature at which
the vapor pressure is equal to the atmospheric pressure. This is a lower temperature.
I can get water boiling at room temperature. How hot is water boiling at room
temperature?
The normal boiling point of a liquid is the temperature at which the vapor
pressure equals 1 atmosphere.

We we looked at the plot of vapor pressure versus temperature we noted the
plot of the three liquids were very similar. The obvious difference is the boiling
point for the three liquids. The vapor pressure of each of the liquids at 25
degrees C should be noted. The vapor pressure of water at 25 degrees C is 23.7
mmHg, for ethanol it is about 55 mmHg and for diethyl ether it is 520 mmHg.
Notice the boiling points for the three liquids. Water boils at 100 degrees
C, ethanol at 78. 3 degrees C and ether at 34.6degrees C. At a given temperature
a comparison of the vapor pressure suggests the liquid with the highest vapor
pressure will have the lower boiling point. At a given temperature a high vapor
pressure indicates there is a large number of molecules of the substance in
the vapor phase. The more molecules in the vapor phase at a given temperature
the easier it is for the molecules to escape into the vapor phase. The greater
the number of molecules in the vapor phase at a given temperature the weaker
the attractive forces between the molecules and the lower the energy required
to vaporize the molecules. That is there is a relationship between the heat
of vaporization and the vapor pressure of a liquid.
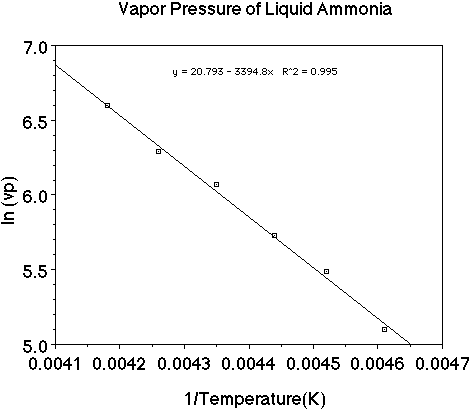
Looking at the plot of vapor pressure versus temperature we can see the exponential
curve. However, if it were possible to obtain a straight line from the data
it would be more useful. If we instead plot the natural log (ln) of the vapor
pressure versus 1/T (K) we do obtain a nice linear relationship.

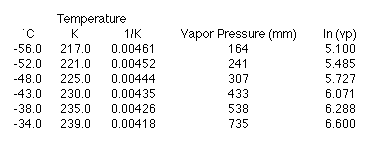
Let's use a set of data as an example and plot the data to see how the heat
of vaporization of a liquid can be determined. (Here is an animation
of this problem.)


Want to try a few problems?