Using the vapor pressure data for acetic acid, CH3COOH(l),
|
Temperature (degrees C)
|
Vapor Pressure (mmHg)
|
10.0
|
6.00
|
20.0
|
11.6
|
30.0
|
21.3
|
40.0
|
37.3
|
50.0
|
63.7
|
Here the table is completed.
T (degrees C)
|
T (Kelvins)
|
T-1
|
Pv (mm Hg)
|
ln (Pv)
|
10.0
|
283
|
0.00353
|
6.00
|
1.79
|
20.0
|
293
|
0.00341
|
11.6
|
2.45
|
30.0
|
303
|
0.00330
|
21.3
|
3.06
|
40.0
|
313
|
0.00319
|
37.3
|
3.62
|
50.0
|
323
|
0.00310
|
63.7
|
4.15
|
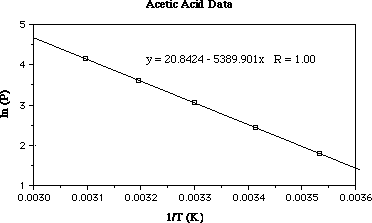
Now plot the data with ln (Pv) on y-axis and on the T-1
x-axis. After you have plotted the data go to the next page to see the plot.

In the plot above I've plotted the data (ln (Pv) versus T-1).
I also did a linear regression on the data to get the equation for the line
(the R value is perfect...great professor data!).
Can do determine the delta H of vaporization for ammonia? Answer.