Throughout this semester and next semester it will be
necessary to convert from one unit to another, or to convert the
mass of reactants converted to products in a given reaction and
for solving unknowns in mathematical equations to obtain
chemically meaningful information. Conversions generally involve
the re–expression of a physical quantity expressed in one
form of units into another form of unit. Perhaps the most useful
approach to these types of problems is dimensional analysis or
unit analysis using equivalences expressed as ratios.
In dimensional analysis involves the conversion between units
requires the use of unit conversion factors. For example the
conversion between meters and centimeters can be accomplished
knowning that
1 meter = 100 centimeters
The unit conversion factor for this definition is;

Either can be used depending on the direction of conversion.
Given the number of centimeters the first unit conversion factor
can be used to convert centimeters to meters. Given the number of
meters the second unit conversion factor can be used to convert
meters to centimeters. For example;

The unit conversions in this case are exact
numbers. We do not have to worry about the number of significant
figures in the unit conversion. However, there are conversion
factors which are not exact and we must use more care. The
conversion of yards to meters is an example. We know that

The number of significant figures in the given quantity will
determine the correct number of significant figures in the unit
conversion. You may wish to use all of significant figures in the
calculation and than round the anser to the correct number of
significant figures. There is a useful list of important
relationships which can be used a conversion factors inside the
back cover of your textbook.

Some other exact unit conversions include;

Sometimes several unit conversion factors must
be used to complete the conversion. To determine the number of
kilograms in 115 pounds might require 2 unit conversion factors.

If we knew the unit conversion factor

The calculation could have been completed with
only one conversion.

Quantities expressed in compound units are more
interesting. Density is a good examples of a compound unit. For
example the density of gold is;

Sample Exercise:
If a sample of gold measured 17 meters on a
side, calculate the mass of the sample.
Solution:
The density of gold is a measure of the mass
of gold per cm3, so if we convert m3 to
cm3 we can use density to determine the mass of
the gold.

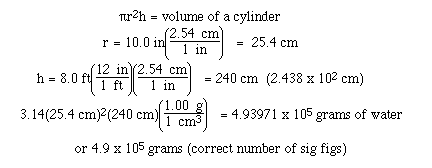
Sample Exercise:
Calculate the mass of water required to fill
a cylinder whose inside dimensions are 8.0 ft high and 20.0
inches in diameter.
Solution:

Sample Exercise:
The estimated water content in moon rock is
0.1 % by mass. Determine the mass of moon rock needed to
extract 1 gallon of water.
Solution:

Temperature Scales
Temperature is a measure of the degrees of hotness and
coldness. Temperature is also the quantity measured with a
thermometer. Three systems for measuring temperature are often
used: the Fahrenheit scale, the Celsius scale and the Kelvin
scale. The second and third are used in most scientific
calculations, while Fahrenheit is used in many engineering
applications. The Fahrenheit scale, named after the Dutch
instrument maker Daniel Gabriel Fahrenheit, defined 0 degrees F
as the temperature of a particular mixture of ice and salt and
defined body temperature as 96 degrees F. On this scale the
freezing point of water as 32 degrees F and the boiling point as
212 degrees F. The Celsius scale, named after the Swedish
astronomer Anders Celsius defines 0 degrees C as the freezing
point of water and 100 degrees C as the boiling point of water.
Both Fahrenheit and Celsius are relative temperature scales. They
define two reference points, divide the range of temperature
between the two points into degrees and compare all other
teperatures to the arbitrary references.
We need to determine the mathematical relationship between
degrees C and degrees F. Here is an
animation determining this relationship. This data was
obtained by simultaneously measuring the temperature of a sample
of ethanol in both degrees C and degrees F. This data is plotted
with degrees F on the y-axis and degrees C on the x-axis.
To begin the problem we must determine the range of the scale on
both axis. On the y-axis the data ranges from -103 to
+172, so we'll set a range of -125 to +175 in 25 degrees
increments. On the x-axis the scale will range from -100
to +100 degrees C. By using these scales we'll be able to plot
all of the data points.
So now plot the data. In the animation each pair of data
points is identified as the data is plot on the graph. Next draw
the best straight line through the data. The general equation for
a straight line is given as y = mx + b where m is the slope of
the line and b is the intercept on the y-axis at x
= 0.
First determine the slope of the line. Select two points
which fall exactly on the line. Usually these two points are not
data points. The slope is determined by measuring the change in y
(rise) and dividing by the change in x (run). So selecting
the two data points and determine the rise, and then the run. The
ratio is 100 divided by 55, which nearly 99 divided by 55, which
is 9/5's.
The y- intercept can be determined by moving the y-axis
over to the point where the line intersects with x=0. We
see this is at 32.
So putting the results together we can determine the equation
for the line.

Sample Exercise;
Which temperature is lower? 0 degrees C or 0 degrees F
Solution;

![]()


![]()
![]()
![]()
![]()
![]()
![]()
![]()


![]()
