![]() Pre-lab Questions
Pre-lab Questions
![]() Experiment
Experiment
![]() Post-lab Questions
Post-lab Questions
EXPERIMENT 11: INTRODUCTION TO BLOCKTRONIC SPECTROMETRY
The following questions should be answered before coming to class. They are intended to introduce you to several ideas important to aspects of the experiment. You must turn in your work to your instructor before you will be allowed to begin the experiment. Reading the introduction and Appendix II will be especially helpful in answering the questions. Be sure to bring a calculator and paper to laboratory.
1. Discuss the difference between the terms spectroscopy, spectrometry and spectrometer.
![]()
2. (a) Sketch a diagram of a simple absorbance spectrometer. Identify the components.
![]()
(b) Explain the purpose of each of the three main components and give at least one example
of a device that could be used.
![]()
3. What information can one obtain by studying the absorbance of a substance?
![]()
4. Define the terms transmittance, percent transmittance and absorbance.
![]()
![]()
5. What is a "blank solution", and why is it necessary to use one in a spectroscopy experiment?
![]()
6. (a) Find in your text the relationship between the wavelength of light and its energy. Write
it below.
![]()
(b) List the colors of visible light from high energy to low.
![]()
(c) Visible light photons have much greater energy than microwave photons. Why is it that
microwave radiation can be used to cook food but visible radiation cannot?
![]()
![]()
EXPERIMENT 11: INTRODUCTION TO BLOCKTRONIC SPECTROMETRY
Introduction:
The word spectroscopy is used to refer to the broad area of science dealing with the absorption, emission, or scattering of electromagnetic radiation by molecules, ions, atoms, or nuclei. Spectroscopic techniques are probably the most widely used analytical methods in the world today. These techniques are useful in determining the identity of an unknown substance or the concentration of a known solute in solution. The measurement of the interaction of electromagnetic radiation with matter is called spectrometry and the device used to make these measurements is called a spectrometer. There are many different types of spectrometers designed to study the different regions of the electromagnetic spectrum. Some of the most widely used are: infrared, visible, ultraviolet, and x-ray spectrometers.
All spectrometers work on the principle that atoms and molecules may exist in only certain specific energy levels; that is, they are quantized. For a review of this idea see your text. Most standard chemistry texts include a discussion of elementary quantum mechanics and atomic energy levels. Molecules can absorb only photons having certain energies or wavelengths. The energies of light absorbed by a molecule can be related to motions (energy modes) of the molecule. A few examples are shown in Table I.

![]()
Although spectrometers differ a great deal in design and operation, they all contain the same
basic components. A schematic diagram of a simple absorption spectrometer is shown in Figure I.

The source provides the electromagnetic radiation that will be absorbed by the sample. It is often some sort of light bulb, lamp, or glower. The monochromator selects one particular energy (wavelength) of light. A prism, a diffraction grating, or a colored filter can serve as a monochromator. (A diffraction grating consists of a large number of closely spaced lines etched on a highly polished surface. The lines act as scattering centers for the incoming radiation, separating white light into the colors of the rainbow.)
![]()
![]()
The detector measures the amount of light that passes through the sample. A phototube (photo cell) or photomultiplier is often used as a detector. All of these work on essentially the same principle. Light falling on the surface of the detector causes current to flow in a surrounding electrical circuit. The amount of current in the circuit is proportional to the amount of light striking the detector. A spectrometer having a phototube as a detector is often called a spectrophotometer.
All the parts of the spectrometer work together as follows: Light from the source passes through the monochromator producing a beam with a single energy or a narrow band of energies. The intensity of this beam, I o, is measured by the detector. A sample of the material to be studied is then placed in the beam between the monochromator and the detector. If some of the light is absorbed by the sample, the intensity of the beam reaching the detector, I , will be less than I o. The two intensities are compared and the result is reported as either percent transmittance (%T) or Absorbance (A). These terms are defined as:

If the monochromator is a prism or a diffraction grating, many different energies (or wavelengths) of light are available. The energy used may be varied from high to low. A plot of absorbance vs. wavelength of light for a sample is called an absorbance spectrum. The absorbance spectrum of a substance is unique, like a human fingerprint, and may be used to identify the sample. Figure II is an infrared absorbance spectrum for butane+ .
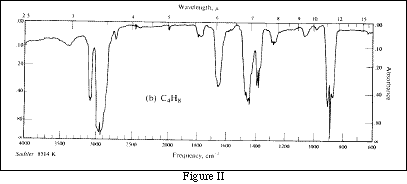
Spectrometers using colored filters as monochromators can not be used to obtain spectra, because they produce only one energy (wavelength) of light. Both types of instruments may be used to determine concentrations.
![]()
![]()
+ This spectrum was taken from Morrison and Boyd, Organic Chemistry, 3rd Edition, Allyn and Bacon.
![]()
![]()
In order to use spectroscopy to determine the concentration of a solution, we must establish a relationship between solute concentration and transmittance or absorbance of the solution. Such a relationship was discovered by Bouguer in 1729 and again by Lambert in 1760. These workers showed that the amount of electromagnetic radiation absorbed by a solution depends exponentially on the path length (the distance that the light travels through the sample). They wrote:
![]()
where
T is the transmittance
I is the intensity of the beam after passing through the solution
I o is the intensity of the beam incident on the solution
b is the path length through the sample, usually expressed in centimeters
k is a proportionality constant
Qualitatively, Bouguer and Lambert's observation makes sense if we think about photons of light passing through a solution of uniformly distributed molecules. The farther the photon travels through this solution (the longer the path length) the more likely it is to encounter a molecule and be absorbed. As the path length increases, the fraction of light transmitted through the solution decreases.
In 1852 Beer and Bernard found a similar relationship between concentration, c, and transmittance:
![]()
where k' is a new proportionality constant.
Qualitatively, the higher the concentration, the more molecules available to absorb photons. Photons moving through a concentrated solution will encounter molecules and be absorbed more often than photons moving through a dilute solution. If the concentration is high, the transmittance will be low.
If we combine the two equations, we can obtain
T = 10-abc
where a is a combined constant replacing k and k'.
A much more convenient form is obtained by taking the negative logarithm of the equation.
-log T = abc
The -log T is definition given previously for Absorbance, A. Thus, we have a simple equation:
A = abc
This relationship is usually referred to as Beer's Law.
![]()
![]()
The constant a is called the absorptivity. It depends on the identity of the sample and the wavelength of electromagnetic radiation used. A given substance will always have the same absorptivity at a particular wavelength. This value may be used to identify the substance. If wavelength is held constant, and the path length is also constant, a and b may be combined into a new constant, m.
A = mc
Note that this is just the equation of a straight line with slope m and y-intercept equal to zero.
If concentration, c, is expressed in moles per liter, and the path length, b, is in cm, absorbance, a , is often replaced with a new symbol, e, and called the molar absorptivity with units of liter. cm-1. mol-1. The molar absorptivity of many substances are recorded in the chemical literature.
Suppose that a series of solutions of some substance were prepared, each having a different known concentration. If the absorbance of each solution is measured at the same wavelength, and a plot is made of absorbance vs. concentration something like Figure III should result. This figure is called a "Beer's Law Plot".
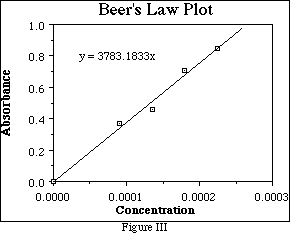
Note that few of the data points, (if any), lie on the line. The line is a "best fit" - that is the line closest to all of the points with the same number of points above and below. The slope of the line can be determined from any two points on the line by the usual formula:
![]()
![]()
![]()
The experimental data points should not be used unless they fall directly on the line! Another, more accurate way of calculating the slope is the method of least squares. This is a statistical method which is derived using calculus. The least square formula for slope of a line is:
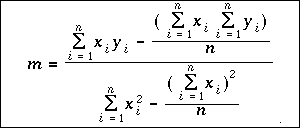
This formula may appear to be very complex, but it is actually quite
easy to use, if you have access to a hand-held scientific calculator. The
variable n is the number of data points. The values xi and yi are the
individual x and y values for for each data point. The Greek letter sigma, ![]() , is
used in mathematics to indicate a sum, so the group of symbols:
, is
used in mathematics to indicate a sum, so the group of symbols:
![]() simply means to add up all n of the x values. The summations in the
equation tell you to multiply each x times its respective y value and add up
the products; sum all of the x values; sum all of the y values; and sum all of
the squares of the x values, and finally, square the sum of the x values.
When you have all of the sums, you can substitute the numbers into the
equation and calculate the slope of the line.
simply means to add up all n of the x values. The summations in the
equation tell you to multiply each x times its respective y value and add up
the products; sum all of the x values; sum all of the y values; and sum all of
the squares of the x values, and finally, square the sum of the x values.
When you have all of the sums, you can substitute the numbers into the
equation and calculate the slope of the line.
Adding all of those values by hand can be tedious. Most scientific calculators have statistical function keys that will do these calculations for you. Some more expensive calculators have the least square (or linear progression) equation pre-programmed, so that you need only enter the values of the x, y pairs (concentration and absorbance). Check your calculator's instruction booklet to see what statistical functions it has and how to use them.
If one is very careful in plotting the points by hand and drawing the best straight line possible through the data points, the value obtained for the slope of the line will approach the least square slope. The least square equation automatically finds the line that is closest to all of the data points. To do this by hand, you have to position the line such that the distance between the line and the points that lie above is equal to the distance between the line and the points that lie below. This is not always easy! It is often less work to calculate the least square slope than to draw a good straight line. It will take much practice to become expert at drawing best fit lines. (If you have access to a computer with a graphing application and a printer capable of printing graphics, you are encouraged to use them to do all plotting in the laboratory. Most commercial graphing applications will draw best fit lines and calculate their slopes for you.)
The Beer's Law Plot is a very useful tool for determining the concentration of an unknown solutions. Suppose a solution of the substance analyzed in Figure III has an absorbance of 0.750. Find absorbance = 0.750 on the y-axis and draw a line parallel to the x-axis through y = 0.750 which intersects the line of "best fit.". Draw a line parallel to the y-axis which intersects the line of
![]()
![]()
"best fit" at the same location. The intercept on the x-axis is the concentration of the solution, about 1.98 x 10⁻⁴ M for this example. (See Figure IV.)
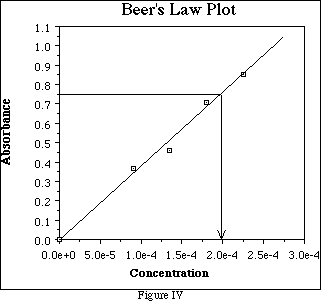
Alternatively, since we knew the slope of the Beer's Law line we could calculate the concentration as follows:

Earlier it was stated that the absorptivity, a in the equation A = abc, depends on the identity of the substance and the wavelength of the electromagnetic radiation. Molecules do not absorb all wavelengths equally well. The most straightforward example of this is to consider a colored object. Human sight is the brain's interpretation of photons of electromagnetic radiation in the visual range (light) which enter the eye. If all the energies (wavelengths) are mixed they are perceived as white light. If no photons enter the eye we "see" black. A color is perceived if only photons of one energy (light of one color, monochromatic light) enters the eye, or if photons of one color are missing from the usual white light mix. A white object appears to be white because it does not absorb any of the light that strikes it. A black object looks black because it absorbs all of the incident light. A rose looks red if it absorbs all the light except the red, or if it absorbs the light of the color complimentary to red - that is, green. An artists color wheel is useful in determine complementary colors. Table II shows a brief list of colors absorbed and observed colors.
![]()
![]()

For more information on color and light see the your text book. Most standard chemistry texts include a discussion of complementary colors and an illustration of a color wheel.
In order to achieve the most accurate results in a spectroscopic
experiment to determine the concentration of a colored species in solution
(also referred to as colorimetric experiment), we need to maximize the
absorptivity of the solution. We must select the color (energy, or wavelength)
of light from our source that is best absorbed by the molecule of interest. The
amount of light absorbed, even in the case of concentrated solutions, is very
small compared to the amount of light available from the source. It is much
easier for the instrument to 'see' the change if we make it as large as possible.
To do this we must use light of the color complementary to the color of the
solution, because this is the color that the solution will absorb best. If our
instrument has a variable monochromator such as a prism or diffraction
grating, it is easy to select the desired color from the source. If, however, the
monochromator is a colored filter, the experiments that can be performed are
limited. Only solutions of the color complementary to the filter can be
accurately determined with such an instrument. If the color produced by the
filtered source is blue, for example, it would be useful only for yellow, orange,
and perhaps red samples. In order to determine the exact wavelength of the
color needed we have to measure the absorbance spectrum of the substance
and find the wavelength at which the maximum absorbance occurs ![]() .
Values for
.
Values for ![]() of many substances can be found in the chemical literature.
of many substances can be found in the chemical literature.
![]()
![]()
EXPERIMENT 11: INTRODUCTION TO BLOCKTRONIC
SPECTROMETRY
![]() Top
Top
EQUIPMENT:

PART I: Beer's Law
Connect the Blocktronic unit to the computer and start running the software as directed in Appendix II, Sections I and II.
Obtain about 40 mL of red or blue stock solution in a 50 mL beaker. (Ask your instructor which color you should use.) Write the name of the color used in Table I. Label 6 18 x 150 mm test tubes 1-6. Rinse clean a 10 mL Mohr pipet with about 5 mL of stock solution, then pipet the volumes listed in Table I into the test tubes. Rinse the pipet with deionized water. Pipet the volumes of water indicated into the test tubes.
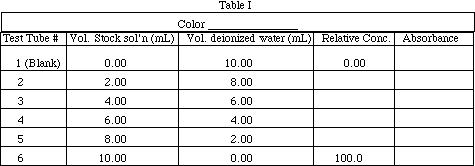
Calculate the relative concentration of solutions 2-6. Show your work for solution #2 as a sample calculation:
Calc. #1
![]()
![]()
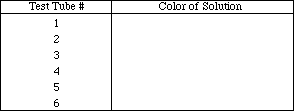
Place a piece of parafilm over the top of test tube 2 and shake to mix the solutions. Repeat for 3-6. Describe the appearance of the solutions in the test tubes.
Obs. #1
Calibrate the Blocktronic unit using Solution #1 (deionized water) as the blank according to the procedure in Appendix, Section III. Measure the absorbance of the 6 solutions (see Appendix II, Section IV for instructions) and record their absorbance values in Table I. After the absorbance values for all of the solutions have been recorded, type "Q" to return to the Blocktronic Main Menu. Make a plot of absorbance (y-axis) vs. concentration (x-axis) on graph paper provided. Using a ruler, draw the best straight line through the 6 data points.
![]()
![]()
From the graph on the previous page, calculate the slope of the line. Show your work. Determine the y-intercept.
Calc #2
![]()
Beer's law is the relationship between the light absorbance of the substance and its
concentration in solution. It was described in detail in the Introduction. Look at your plot.
How well does it follow Beer's Law?
Expl. #1
![]()
Share your data with the rest of the class. List slopes for the red and blue food coloring.

Has Beer's Law been followed by the red and blue food coloring? Explain.
Expl. #2
![]()
![]()
Obtain from your instructor a colored sample of unknown concentration. (Make sure it is the color you used earlier to make your plot!) Record the identification number of the unknown. Measure the absorbance of the unknown. (Refer to the instructions in Sections III and IV of Appendix II as needed.) Use your Beer's Law plot to find the concentration of the unknown.
Table II

Use both words and a diagram to explain how you were able to obtain the concentration of the unknown. (If you have difficulty, refer to the Introduction.)
![]()
![]()
EXPERIMENT 11: INTRODUCTION TO BLOCKTRONIC SPECTROMETRY
EQUIPMENT:

Part II: Color and Absorbance
The Introduction describes the relationship between the observed color of an object and the colors of light that it absorbs. The LED that is used in the Blocktronic spectrometer emits green light (maximum emission 500-600 nm). What color(s) of solutions (Red, Blue, Yellow, Green) do you think will absorb the light emitted from the LED in the Blocktronic?
Expl. #3
![]()
What color(s) will not absorb the light very well?
Expl. #4
![]()
![]()
We will now make some measurements to test your predictions. Prepare four solutions as follows:
Pour 100 mL of deionized water into each of four 250 mL beakers. To the first, add 3 drops of red food color, to the second 3 drops of blue, to the third 3 drops of yellow and to the fourth 3 drops of green food color. Try to make the drops as small as possible. Stir each solution with a clean glass rod. Measure the absorbance of each solution with the Blocktronic using distiled water as the blank. Record the absorbance of each in Table II. (See Appendix II sections I, II, III, and IV as needed for instructions on using the Blocktronic.)
Obs. #2
![]()

![]()
List the colors from most to least absorbing.
Obs. #3
![]()
Does the list agree with your prediction? If not, what difference do you see?
Expl. #4
![]()
One of the colors used may not be a true "color", but a mixture of two of the others. Can
you tell which one based on absorbance readings?
Expl. #5
![]()
![]()
Can you suggest any ways to prove that this color is a mixture? List one method involving spectroscopy and at least one other method that we have used this year. If time and your instructor will allow, try your methods in the lab.
Expl. #6
![]()
For best results, what color(s) solutions should we attempt to determine with the Blocktronic?
Expl. #7
![]()
![]()
Both the experimental procedures and the Introduction of the experiment will assist you in your work.
1. Explain both qualitatively and quantitatively how concentration and path length affect the transmittance of a solution.
![]()
2. What is "molar absorptivity"?
![]()
3. What are the units of absorbance? Explain.
![]()
![]()
For questions 4 -10, use the following data

![]()
4. Make a Beer's Law plot of the data using the graph paper provided. Use a ruler to draw the best straight line through the data points. Select any two points on the line and use these to find the slope of the line.
![]()
5. Use the least squares method to find the slope of the line. Compare with the result of #4.
![]()
6. If the path length of the sample is 1 cm, find the molar absorptivity of the substance at 450
nm.
![]()
7. What color would you expect the sample to be? Explain your reasoning.
![]()
8. What is the concentration of a solution of this substance having an absorbance of 0.58 at 450
nm? Show work or explain clearly how the answer was obtained.
![]()
9. What would be the absorbance of a solution if its concentration is 7.5 x 10⁻³ M?
![]()
10. Could the measurements recorded have been made using a Blocktronic spectrometer? Explain
your answer.
![]()
![]()
11. List at least 2 pairs of complementary colors.
![]()
12. If an object absorbs a single color of visible light, what color will the object appear to be?
![]()
13. An extra spectroscopic poem, for your consideration:
Rubies are Red,
Emeralds are Green,
Sapphires absorb
Where fire is seen.
The color of these is often found blue.
Explain, if you will, why this is true.
![]()
![]()
Contents
![]() Return to
Return to![]() Index of Experiments
Index of Experiments