We began Chapter 12 reviewing our particulate level view of the three phases
of matter; gas,
liquid and solid. We noted in a solid the atoms or molecules are tightly
packed with little free space for the particules to move around. In a liquid
the particles are still tighly packed, but there is more space available for
particles to move. Liquids can flow, so the atoms or molecules can move relative
to each other. In a fas the particles are well separated from each other in
space. Gases also flow, and can be compressed easily. These representations
are important for us to have as images to understand the content of this chapter.
In terms of energy how do we view the three phases of matter and there transitions
between phases. We view a diagram depicting the three
phases of matter on an energy scale and we discussed it in detail. Beginning
with the solid phase it has the lowest energy. To move to the liquid phase we
must add energy. The transition from solid to liquid, melting, is endothermic
(we must add energy). When a liquid freezes the process is exothermic. Heat
flows from the liquid water to the surroundings. We place liquid water in a
freezer, a region where the temperature is below the freezing point of water,
and heat flows from the liquid water into the surrounds causing the water to
freeze. The liquid phase is higher in energy compared to the solid phase. The
gas phase is even higher in energy. The phase change from liquid to vapor (gas)
is called vaporization and it is endo thermic. When the vapor phase condenses
to the liquid the process is exothermic. Anyone who has burned themselves by
coming in contact with steam understands the amount of heat associated with
the condensation of water vapor. The phase change from solid to vapor is called
sublimation, while from vapor to solid it is called deposition. In this discussion
our goal is to become familiar with the terms used to describe the different
phase transitions and to understand in qualitative terms the energy flow that
occurs in the transitions.
Next we viewed an animation showing a particulate
level view of the three phases as the temperature of a sample is cooled.
A container of gas particles was cooled. As the temperature of a collection
of particles was lower we observed the particles slowing down. At the lower
velocities colliding particles appeared to stick together forming groups of
particles. As the temperature continued to drop the number of particles in these
groups increased. Eventually the groups of particles are of sufficient size
that they fall to the bottom of the container as a result of force of gravity,
forming a liquid. As the temperature continues to drop the particles become
more ordered, and their translational energy drops to a very small value and
a solid forms. Condensation occurs when the intermolecular attraction between
a pair of particles exceeds the kinetic energy of the collision.
The 'stickyness' exhibited by particles at the lower temperatures, which
result in the formation of liquids and eventually solids is due to intermolecular
attractive forces. Intermolecular means between molecules. Intramolecular means
between atoms. Intramolecular forces are what we call covalent bonds and are
very strong (100 - 1000 kJ/mol). Intermolecular forces are between molecules
and are weak (0.1 - 40 kJ/mol). Intermolecular forces are less directional compared
to covalent bonds and operate over a longer range compared to covalent bonds.
It is intermolecular forces which explain the formation of liquids and solids
in covalent compounds. Intermolecular attractive forces are electrostatic in
nature.
Intermolecular forces are classified into the following categories;
* ion-dipole
* dipole-dipole
* induced dipole-induced dipole (London dispersion forces)
* hydrogen-bonding
We will discuss these different intermolecular attractive forces in a few
lectures.
Next we explored the in more detail the energy changes associated with phase
transitions. We viewed a diagram called a heating curve
showing enthalpy (heat) on the y-axis and temperature on the x-axis. In the
heating curve we observe that as heat is added to a sample, beginning with a
solid, the temperature of the sample begins to increase linearly. The temperature
of the sample continues to increase until we reach the melting point of the
solid. At the melting point the temperature of the sample does not change as
heat is added. The reason for this is the heat being added is used to cause
a phase change from solid to liquid. As mentioned earlier the intermolecular
attractive forces between the atoms of molecules in the solid phase must be
overcome (broken) to form the liquid phase. As these intermolecular attractive
forces are partially overcome the temperature remains constant. Once all of
the solid is melted, the temperature of the liquid increases linearly until
the boiling point of the liquid is reached. At this phase change we observe
the same behavior as noted in the solid/liquid phase change. The temperature
remains constant until all of the liquid is vaporized to a liquid. Again the
reason the temperature does not change during the phase transition is the heat
is used to overcome the intermolecular attractive forces remaining in the liquid
phase. Note the amount of heat required to convert the liquid to its vapor is
significantly greater compared to the heat required to convert the solid to
its liquid. The amount of intermolecular attractive forces that must be overcome
in the liquid to vapor transition is much greeater compared to the solid to
liquid transition. Once all of the sample in in the vapor phase the addition
of heat causes the temperature of the gas to change linearly again.
Next we discussed in quantitative terms the energy relationships of the different
steps as we moved from a solid below its melting point to a vapor above its
boiling point. When we begin with a solid below its melting point the change
in temperature is controlled by the amount of substance and its specific heat.
Recall the specific heat of a substance is the amount of heat required to change
the temperature of 1 gram of the substance by 1 degree celsius. For solid water
the specific heat is 2.09 J g-1 C-1. So if we know the
mass of the solid water and the temperture change we can determine how much
heat is absorbed. At the melting point the amount of heat absorbed during the
phase change is determined by the enthalpy of fusion, delta Hfusion.
For water the enthaply of fusion is 6.01 kJ mol-1. Notice there is
no temperature term in the heat of fusion. Recall the temperature remained constant
during the phase transition from solid to liquid. In the liquid phase the heat
required to change the temperature of 1 gram of water by 1 degree Celsius is
4.184 J g-1 C-1. The heat of vaporization for water is
40.67 kJ mol-1. The specific heat for the solid phase of water is
1.84 J g-1 C-1. So how do we combine all this information
to determine the heat required to change the temperature of a sample of water?
Here is a summary table of the specific heats and enthalpy of phase changes
for water;
Specific Heat of H2O(s)
|
2.09 J g-1 C-1
|
Specific Heat of H2O(l)
|
4.184 J g-1 C-1
|
Specific Heat of H2O(g)
|
1.84 J g-1 C-1
|
Enthalpy of fusion
|
6.01 kJ mol-1
|
Enthalpy of vaporization
|
40.67 kJ mol-1
|
Let's look at several sample problems;
How much heat is required to change 36.0 g of H2O(l) at 100 deg
C to 36.0 g of H2O(g) at 100 deg C? Answer
How much heat is required to convert 30.0 g of H2O(s) at -10 deg
C to 30.0 g of H2O(g) at 110 degC. Answer
The specific heat of iron is 0.433 J g-1 C-1. What is
the final temperature if 45.0 g of iron, initially at 95 deg C, is added to
100.0 g of water at 23.0 deg C? Answer.
Evaporation
Imagine a sample of a liquid in a beaker left out in a warm room for an extended
period of time. What happens to the liquid in the beaker? It evaporates, that
is, if we left the beaker there and returned after several days we would expect
all the liquid to be gone. Where did it go? Into the atmosphere. How does the
liquid, like water, at room temperature, evaporate?
How do we understand the nature of evaporation? Can we use the kinetic molecular
model to explain evaporation? And if we can, what new properties might the model
lead us to consider?
In a sample of a liquid the particles are in constant, chaotic motion (here
is the animation we used in class). At the particular
temperature the particles of a liquid have an average kinetic energy. But remember
there is a distribution of energies do that some particles have a high energy
and some have low energy. If a particle in the liquid phase has enough energy
and its velocity vector is oriented in the proper direction it can escape into
the vapor phase. Even though vaporization is an endothermic process since the
liquid is in a large room at constant temperature the room maintains the temperature
of the liquid. If the beaker is left open to the atmosphere eventually all of
the liquid evaporates. If we place a lid over the beaker to prevent the escape
of the water vapor in the room the volume of the water will not change. In this
case the water molecules escape into the air above the surface of the liquid.
After a while, when the number of molecules of water in the air above the liquid
become large, some molecules in the vapor phase condense by colliding with the
liquid. After a period of time the rate of escape of molecules from the liquid
phase equals the rate of condensation of vapor into the liquid phase. When this
occurs the system is in equilibrium. That is the two rates are equal, and there
is no net change. If a particle in the vapor phase condenses, an instant later
a particle evaporates. The system is in a state of dynamic equilibrium. That
is particles are constantly changing from vapor to liquid phase and visa versa.
However, if we measure the vapor pressure of the sample we see there is no change
in pressure over time. The pressure exerted by the water molecules in the vapor
phase, above the liquid, is called the vapor pressure of the liquid at the particular
temperature.
Next we continued our discussion of vapor pressure of liquids by turning
our attention to a demonstration setup showing three barometers. (Here is an
animation of the demonstration we performed live
in class.) The glass tubes contained mercury. No (ideally) air molecules are
found in the space above the mercury, i.e. a vacuum.
A sample of liquid introduced at the bottom of the column the liquid will
rise up the tube to the top of the mercury, because of density differences.
When the reaches the space above the mercury the liquid will immediately vaporize
to an extent equal to or less than the vapor pressure of the liquid at the particular
temperature. Whether the pressure exerted is equal to the vapor pressure of
the liquid depends on the amount of liquid injected. If we introduce water,
ethanol and ether into different columns we can see the difference in the vapor
pressure, at room temperature of each liquid. Water first. Notice the difference
in the height of the column of mercury after introducing the water sample. The
change in height is equal to the vapor pressure of the water (23.7 mmHg) at
23 degrees C. Notice there is a small amount of liquid water resting on the
surface of the mercury. Next we'll try ethanol. Notice the vapor pressure of
ethanol is greater at the same temperature (55 mmHg). Finally we tried ether.
First a small amount. We noticed the height of the column of mercury, but also
notice that there was no liquid on the surface of the mercury. This meant that
all of the liquid introduced vaporized. It all vaporized because the resulting
pressure exerted by the sample of ether is smaller than the vapor pressure of
ether. So more ether had to be added. And the level of the mercury drops even
further. Finally it has reached a level equal to the vapor pressure (diethyl
ether it is 520 mmHg).
Next we looked a plot of vapor pressure (y-axis) versus temperature (x-axis)
and observed the exponential increase in vapor pressure with temperature. We
also discussed the definition of a boiling point. The correct definition of
boiling point is the temperature at which the vapor pressure of a liquid equals
atmospheric pressure. With this definition we can understand why liquids boil
at lower temperatures when heated at high altitudes. At high altitudes the atmospheric
pressure is lower, there is less atmosphere above the surface at high altitudes.
If the atmospheric pressure is lower water will boil at a temperature at which
the vapor pressure is equal to the atmospheric pressure. This is a lower temperature.
I can get water boiling at room temperature. How hot is water boiling at room
temperature?
The normal boiling point of a liquid is the temperature at which the vapor
pressure equals 1 atmosphere.
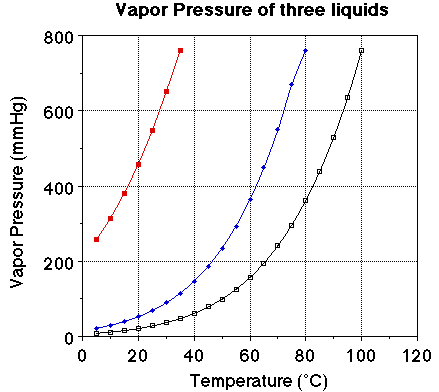
We we looked at the plot of vapor pressure versus temperature we noted the
plot of the three liquids were very similar. The obvious difference is the boiling
point for the three liquids. The vapor pressure of each of the liquids at 25
degrees C should be noted. The vapor pressure of water at 25 degrees C is 23.7
mmHg, for ethanol it is about 55 mmHg and for diethyl ether it is 520 mmHg.
Notice the boiling points for the three liquids. Water boils at 100 degrees
C, ethanol at 78. 3 degrees C and ether at 34.6degrees C. At a given temperature
a comparison of the vapor pressure suggests the liquid with the highest vapor
pressure will have the lower boiling point. At a given temperature a high vapor
pressure indicates there is a large number of molecules of the substance in
the vapor phase. The more molecules in the vapor phase at a given temperature
the easier it is for the molecules to escape into the vapor phase. The greater
the number of molecules in the vapor phase at a given temperature the weaker
the attractive forces between the molecules and the lower the energy required
to vaporize the molecules. That is there is a relationship between the heat
of vaporization and the vapor pressure of a liquid.
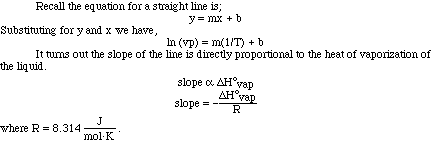
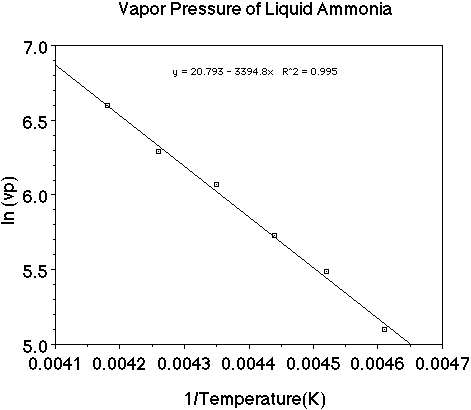
Looking at the plot of vapor pressure versus temperature we can see the exponential
curve. However, if it were possible to obtain a straight line from the data
it would be more useful. If we instead plot the natural log (ln) of the vapor
pressure versus 1/T (K) we do obtain a nice linear relationship.
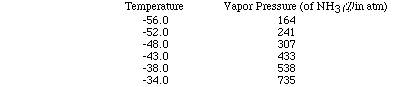
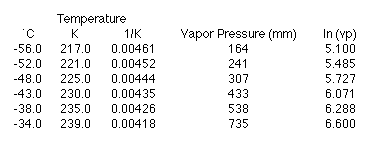
Let's use a set of data as an example and plot the data to see how the heat
of vaporization of a liquid can be determined. (Here is an animation
of this problem.)
Want to try a few problems?
Problem 2
Problem 3